
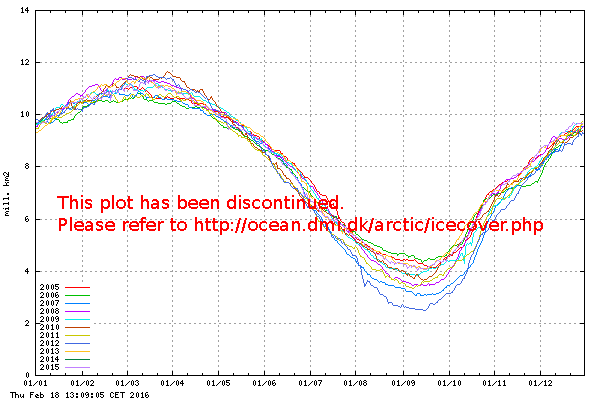
It is an article of faith that global warming is increasing hurricane numbers and intensity. It doesn't jump out of this chart:

Here's where the critics of Webster et al. differ. Let's look at the criticisms one ocean basin at a time. First: the Southern Hemisphere oceans, and the part of the Indian Ocean in the Northern Hemisphere. These regions are responsible for 25% of the world's Category 4 and 5 hurricanes. Webster et al. found a huge increase in these storms, from 34 during the 1975-1989 period, to 79 during succeeding 15 year period. Dr. Gray criticizes the quality of the data in the Indian Ocean and Southern Hemisphere ocean basins during the period 1975-1989, remarking: "In the late 1970s I visited all the global tropical cyclone centers and observed their satellite capabilities and the training of their forecasters as part of a World Meteorological Organization (WMO) tropical cyclone trip that I was commissioned to make. The satellite tools and forecaster training in the tropical cyclone regions of the Indian Ocean and Southern Hemisphere during the 1975-1989 period was not adequate for the task of objectively distinguishing Category 4-5 hurricanes from Category 3 hurricanes or to always be able to confidently distinguish Category 4-5 hurricanes from Category 1-2 hurricanes." Dr. Gray does not provide any details about how how this lack of training could have led to a systematic error in classifying too few storms at Category 4 and 5 intensity. However, Dr. Landsea did cite an example of this in his talk at the 2006 American Meteorological Society meeting--for a number of years after 1974's Tropical Cyclone Tracy devastated Darwin, the Australians never assigned an intensity higher than Tracy to any storm because they believed Tracy was the strongest a storm could be in the Australian region. Tracy was a weak Category 4 cyclone with 135 mph winds and a 954 mb pressure. This was a false assumption, as many cyclones stronger than Tracy have formed in Australian waters.
This brings up the most serious weakness in the Webster et al. paper--they do very little discussion of the uncertainty in hurricane intensity measurements. Hurricane intensity is characterized by a 1-minute measurement of maximum sustained winds at ten meters above the surface. In practice, this quantity is virtually never measured, but must be inferred indirectly from other measurements. All of these inferred measurements of wind speeds have errors. Satellite estimates of hurricane intensity are often wrong by a full category on the Saffir-Simpson scale--or even two categories. This is particularly true when there are only two geostationary satellites covering the Earth, as was the case for much of the 1970s, and part of the 1980s. I learned this the hard way during my stint with the Hurricane Hunters when I flew into Hurricane Hugo in 1989 expecting a Category 3 hurricane based on satellite estimates. The problem was that one of the GOES satellites had failed earlier that year, leaving just one satellite to cover all of the U.S. and Atlantic Ocean. This one satellite was positioned much farther west in order to see all the way to California, and thus had a poor, oblique view of hurricanes out over the Atlantic. If a satellite can't see all the way to the bottom of the eye of a hurricane because of an oblique viewing angle, it will come up with an eye temperature that is too cool, and thus an intensity estimate that is too low. Hugo turned out to be a Category 5, and made us pay dearly for our mistake. Similarly, a systematic underestimation of hurricane intensities in the 1970s is quite possible, due to the oblique viewing angle that the relatively few geostationary satellites afforded during that period.
Furthermore, Dr. Landsea argued, the technique used to perform satellite estimation in all ocean basins of hurricane intensity (the Dvorak technique) did not even get invented until 1972--two years after the start of the data used by Webster et al. It wasn't until 1984 that the Dvorak technique was extended to infrared satellite imagery. So, between 1972 and 1984, all satellite hurricane intensity estimates were done on visible satellite imagery, and were unavailable at night. In addition, measurement errors from the first generation of infrared satellite instruments was much higher, since their resolution was a relatively poor 9 km--compared to the 4 km resolution of today's instruments. Dr. Landsea called for a major re-analysis effort of the old satellite photos from the 1970s and 1980s to try to quantify some of these errors. He argued that his preliminary look at old satellite images from the Northern Indian Ocean from 1970 to 1989 had already revealed five additional storms that may have been Category 4 or 5. Webster et al. found only one Category 4 or 5 hurricane for this time period there. Dr. Landsea suggested that until a full re-analysis took place in all ocean basins, the quality of the historical global hurricane intensity data was not high enough to be able to see a possible increase in the number of Category 4 and 5 hurricanes.
The subject is really complicated, and any particular weather event means nothing.
ReplyDeleteThe science really is settled on the fact that increasing CO2 concentration will bend the temperature curve upwards. Folks who dispute that just don't understand the simple physics behind it.
But, the amount of temperature increase from a given amount of CO2 increase is not settled, no matter what people claim. That value is called the "sensitivity." The simple physics model - the only one that is really solid - says that temps will increase about 1 degree Celsius per doubling of the CO2 concentration - contrary to what people claim, the effect is logarithmic. But the simple physics model does not include feedback. All of the serious dispute is about the effects of the feedback - and even the sign of it. Positive feedback would increase the sensitivity over the simple value. Negative feedback would reduce it. There are arguments both ways, although the overall very long term stability of earth's climate suggests that the feedback is negative, or becomes negative as the temperature increases.
So much for theory. Getting back to the temperature record... Most people focus on surface temperatures, for no good reason at all. Surface temps are the worst thing to look at - there are way too many extraneous influences on surface temperature. As a result, temperature series are corrected, and needless to say these corrections are very controversial. Any time you correct a time series, you are adding uncertainty to it.
Better measures are ocean temperature (not ocean surface, but deeper than that) and satellite derived middle and upper atmosphere temperature. Ocean temperature has not been well measured for any significant period of time, so it's hard to draw conclusions from it. Satellite measured temperature has been carefully gathered for over 30 years. It shows no warming in the last 18 years, and frankly, I'll take that over the other measurements.
Future temperature forecasts come from climate models. Lots of credence is given those models, but they missed the climate pause entirely. I don't take them seriously, but the warmists do. Tens of billions of our tax dollars go to tweaking these more and more - to no avail as far as I can tell. The models are not really science - you can't test the result. I would call the work on them more like engineering of instruments. They are trying to improve the instrument, but they don't have any falsifiable experiments - except the climate pause which falsified the models for that period!
Another thing you can tell your friend: we have increased the CO2 concentration by over 30% in the last 150 years. CO2 is the primary food for plants - they breathe CO2 like we breathe oxygen. The result is a substantial and well measured greening of the earth. That same 30% (okay, a bit more 400/275) translates to a change in the total atmosphere of about .01%! That's not much.
You may want to look at section 2.6.3 of the WG1 section of the IPCC's AR5. The only increase in storm frequency or intensity it finds is for the N Atlantic from 1970 to 2010 (and that study is a pretty clear example of cherry picking applied to a time series - 1970 is one the low points for NA hurricane activity in the historical record and 2010 one of the high points - this is clearly visible in figure 2.34). http://www.ipcc.ch/pdf/assessment-report/ar5/wg1/WG1AR5_Chapter02_FINAL.pdf
ReplyDelete